Thursday, April 26, 2012

Lab 3


Solar Eclipse Travel Map


View GIS Lab 3: Solar Eclipse Trip with map description in a larger map (suggested)

Neogeography Write Up

My experience in creating a custom map clearly elucidates many of the benefits of neogeography, which center primarily around the advantages of crowd-sourcing and user generated content. First, the integration with business information provided by other users can be seen as a significant aspect for the potential of neogeography. As implemented in my map, this integration allows individuals to supplement custom maps with predefined information about a specific location. Second, the option of creating lines along streets within the Google Maps toolkit allows individuals to publish accurate travel directions with ease. In the case of my map, this feature was used heavily in order to map a road trip between destinations in the Southwest. By implementing road travel information, neogeography as an entity extends spatial awareness of the general public and allows individuals to share individual travel with others. In today's era of smartphone proliferation, neogeography enables the dispersal of individual location data through platforms such as Google Latitude that integrate with mapping platforms such as Google Maps. Finally, as another major point of neogeographic potential, products such as Google Map Maker allow individuals to contribute to the overall content of maps by providing polygonal and nominal content. In my experience with locating the the area covered by the Very Large Array in New Mexico, I noticed that this information was not presented on Google Maps. Nevertheless, I am able to provide this information for future users of the service after accurately outlining such a structure and submitting my edits through Google Map Maker. 

Although plenty of advantages stem from the use and proliferation of neogeographic tools, several issues arise from the use of neogeographic information. The most apparent problem associated with neogeography relates to the issue of inaccurate content provided by volunteers. For example, in my experience with locating the Lightning Field in New Mexico, the suggested location provided by another user was nearly 3km away from the true location. Another example can be seen in the use of supplementary information such as business information. I personally noticed multiple mistakes in some of the user provided data and therefore decided to forego the inclusion of such information in my custom map. This problem is most recognizable in Google's photo geotagging platform Panoramio, in which most of the location data is dramatically incorrect. Another major concern with neogeography are the multiple standards in terms of geographic data that mapping platforms such as Google Maps create. As mentioned by Turner in Introduction to Neogeography, Google and other companies have in essence created a new datum that is significantly different from other established datums such as the North American Datum. As a result, scholarly geography is faced with the issue of determining the standards of authority.

In my evaluation of the aforementioned pitfalls and potential benefits of neogeography, I ultimately contend that the advantages of neogeography significantly outweigh the disadvantages. I strongly support the empowerment of individuals to share their local knowledge and believe that as technology advances many of the concerns such as misinformation and authority will fade.

Thursday, April 19, 2012

Lab 2


  1. Beverly Hills
  2. Canoga Park, Van Nuys, Burbank, Topanga, Hollywood, Venice, Inglewood
  3. 1966
  4. 1929 - National Geodetic Datum of 1929
  5. 1: 24,000
  6. At The Above Scale
    1. 1,200 meters
    2. 1.894 miles
    3. 2.64 inches
    4. 12.5 centimeters
  7. 20 feet
  8. Geographic Coordinates
    1. Public Affairs
      1. 34° 04' 40",  -118° 26' 15"
      2. 34.0778°,  -118.4375°
    2. Tip of the Santa Monica Pier
      1. 34° 00' 45",  -118° 29' 50"
      2. 34.0125°,  -118.4972°
    3. Upper Franklin Canyon Reservoir
      1. 34° 07' 15", -118° 24' 30"
      2. 34.1208°,  -118.4083°
  9. Approximate Elevation
    1. Greystone Mansion
      1. 560 feet
      2. 171 meters
    2. Woodlawn Cemetery
      1. 140 feet
      2. 43 meters
    3. Crestwood Hills Park
      1. 700 feet
      2. 213 meters
  10. UTM Zone 11
  11. 11N 361500 3763000
  12. 1,000,000 square meters
  13. Elevation Profile

    14. 14°
    15. South
    16. UCLA Map

Thursday, April 5, 2012

Lab 1

This map shows the global distribution of cigarette smokers as a percentage of a nation's total population by gender. The data source comes from the Tobacco Atlas provided by the American Cancer Society and World Lung Foundation published in 2012. The map was created by The Economist and uses the 2010 data provided by the Tobacco Atlas. The map is particularly striking because it illuminates first and foremost the larger number of male cigarette smokers. In most of the world, the percentage of female cigarette smokers is relatively low and in almost all nations the percentage of male smokers is larger than the percentage of female smokers. Furthermore, the graph highlights regions of the world where cigarette consumption is highest (at least among men) such as Russia, China and Indonesia. 
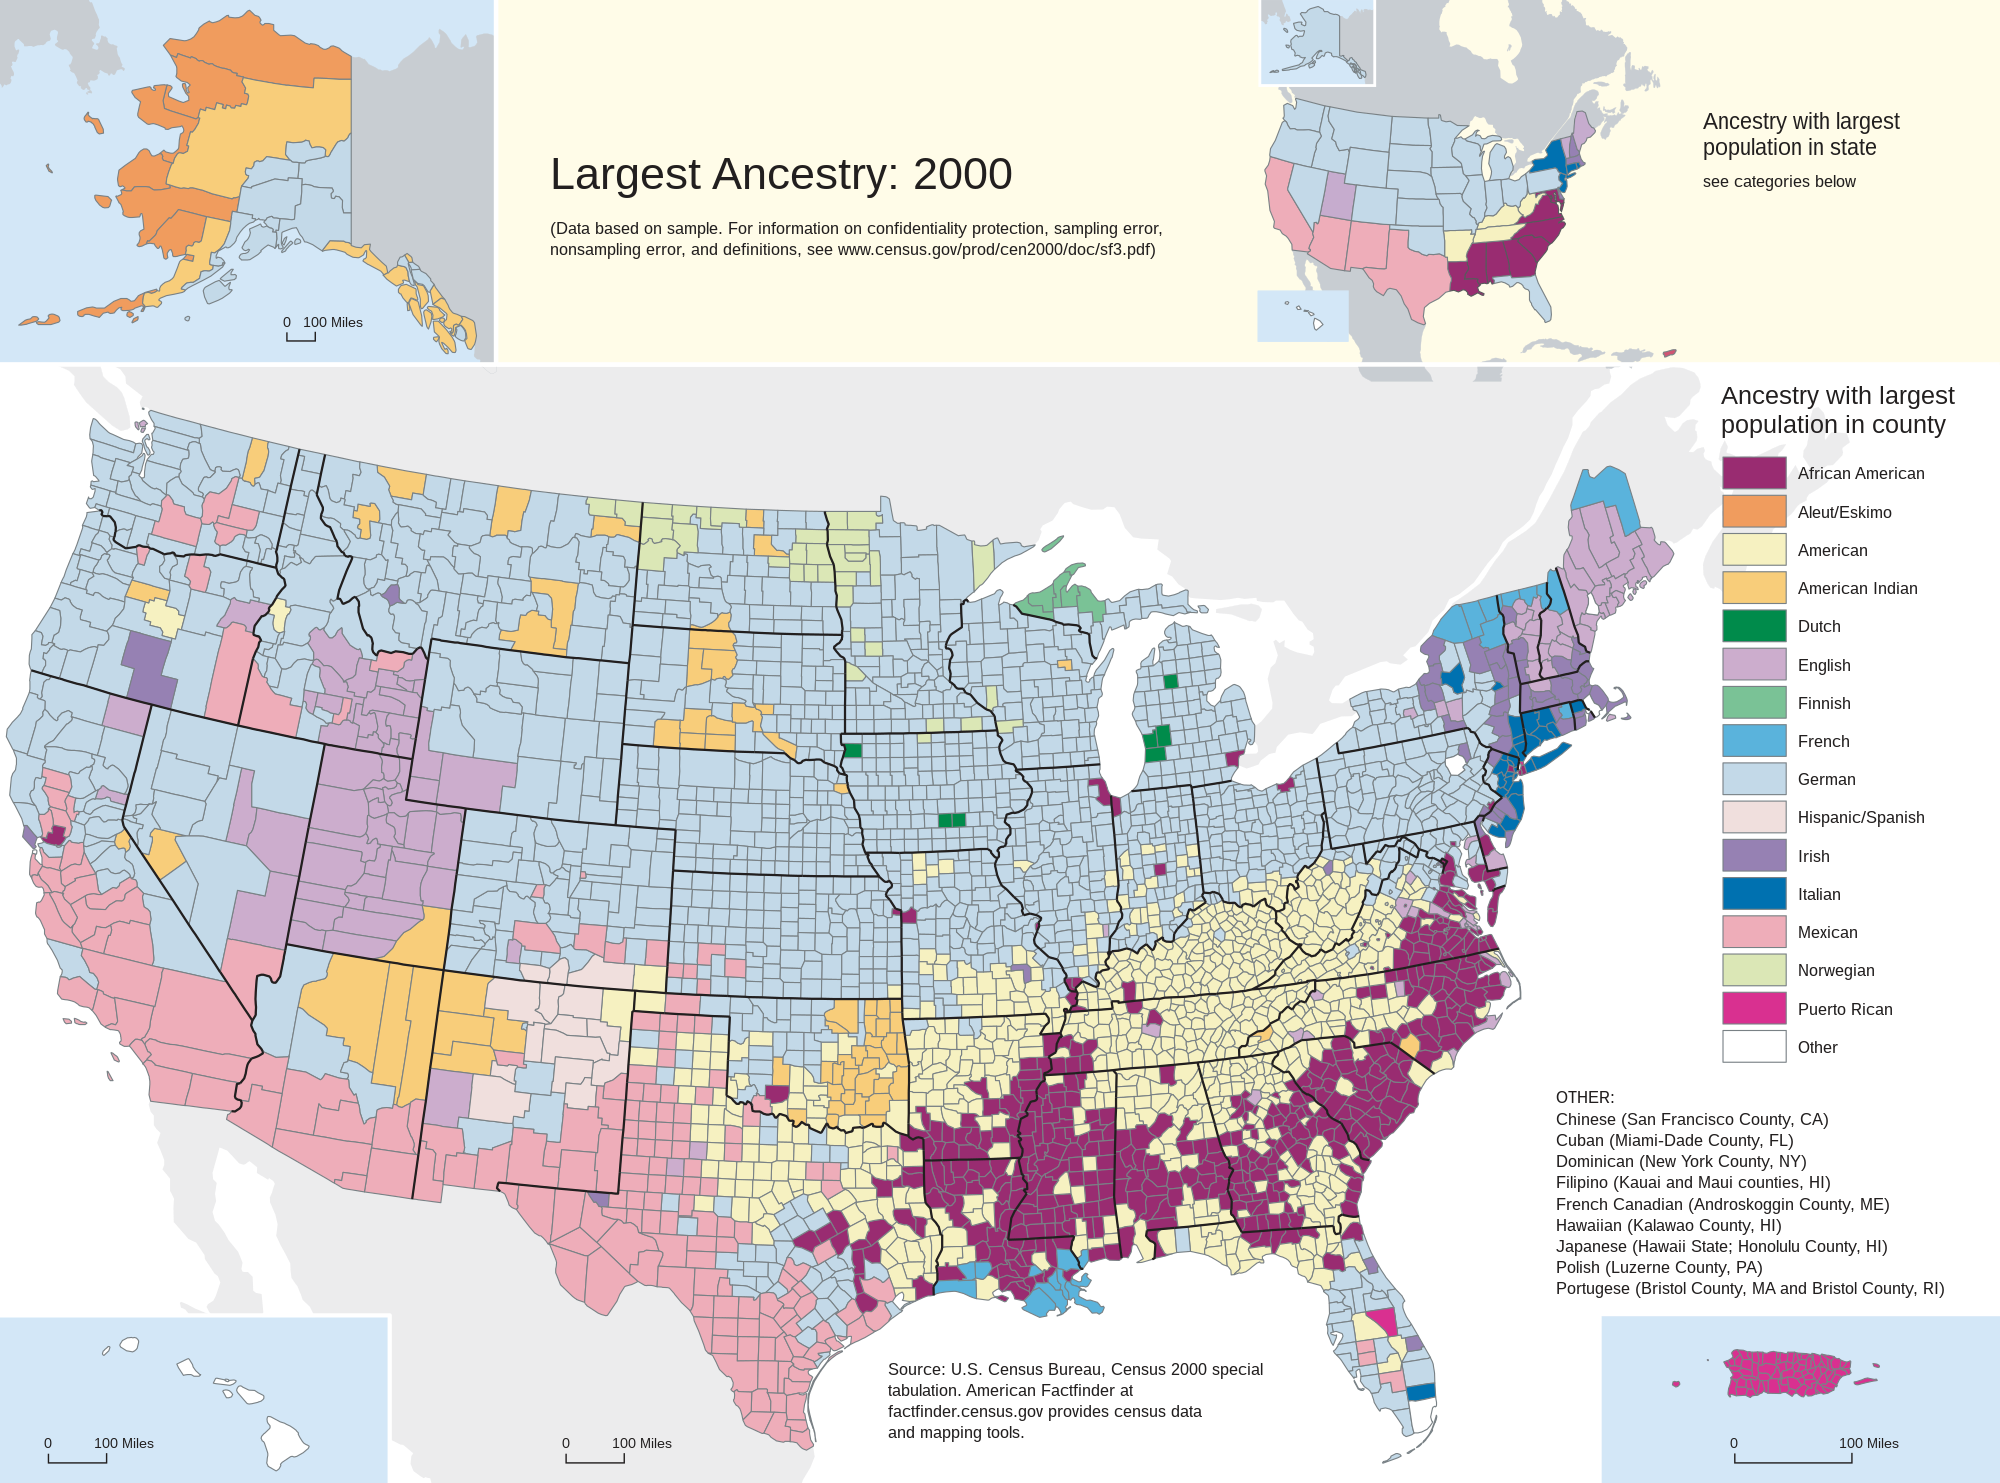
This map presents the plurality ethnic background by county in the United States. The map uses data from the U.S. Census Bureau taken from the 2000 census and is provided by Wikipedia. The map is insightful because it demonstrates how clusters of ethnic backgrounds have formed in the United States. A number of patterns also arise when examining the map. First, one can see how counties that are geographically close to the Mexican border contain a Mexican ethnic plurality. Second, German ancestry is the ethnic plurality for the much of the Northern continental U.S. Third, one can recognize a "belt" formation that spreads across the southern states where African Americans are a plurality. These points are further reinforced when examining the secondary map in the upper right hand corner, which presents the plurality ancestry by state in the United States. 

This map demonstrates the US population change by county between the years 1930 and 1940. Population changes are exhibited both by percentage changes in the first map and absolute numeric changes in the second map. The map is particularly interesting as it shows the effects of the Dust Bowl in the 1930s on migration patterns within the United States. As one can see, populations declined most drastically in the Midwest, which in some cases exceeded population losses of over 25%. Furthermore, the map highlights individual counties of significant growth during this period. For instance, the map establishes the extreme population increase in Los Angeles county of more than 500,000 people. As a result, I find it intriguing how the map presents the effects of the largest internal US migration in the 20th century.  The map data comes from the 1930 and 1940 US Census and was provided by the US Census Bureau